- Page 1
- Page 2
- Page 3
- Page 4
- Page 5
- Page 6
- Page 7
- Page 8
- Page 9
- Page 10
- Page 11
- Page 12
- Page 13
- Page 14
- Page 15
- Page 16
- Page 17
- Page 18
- Page 19
- Page 20
- Page 21
- Page 22
- Page 23
- Page 24
- Page 25
- Page 26
- Page 27
- Page 28
- Page 29
- Page 30
- Page 31
- Page 32
- Page 33
- Page 34
- Page 35
- Page 36
- Page 37
- Page 38
- Page 39
- Page 40
- Page 41
- Page 42
- Page 43
- Page 44
- Page 45
- Page 46
- Page 47
- Page 48
- Page 49
- Page 50
- Page 51
- Page 52
- Page 53
- Page 54
- Page 55
- Page 56
- Flash version
© UniFlip.com
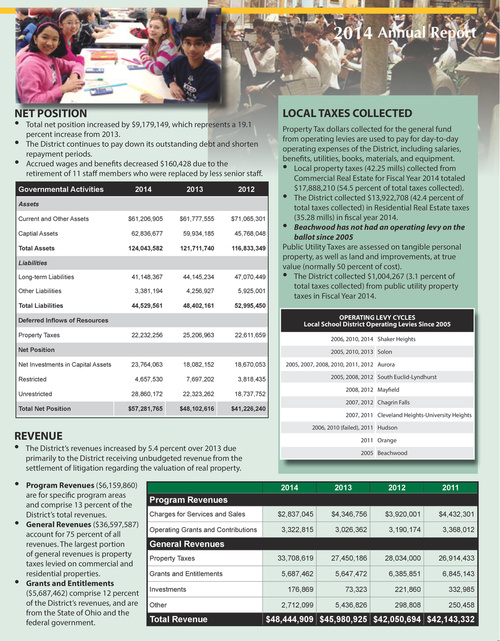
2014 Annual Report
NET POSITION
• Total net position increased by $9,179,149, which represents a 19.1 percent increase from 2013. • The District continues to pay down its outstanding debt and shorten repayment periods. • Accrued wages and benefits decreased $160,428 due to the
Governmental Activities
Assets Current and Other Assets Captial Assets Total Assets Liabilities Long-term Liabilities Other Liabilities Total Liabilities Deferred Inflows of Resources Property Taxes Net Position Net Investments in Capital Assets Restricted Unrestricted Total Net Position 23,764,063 4,657,530 28,860,172 $57,281,765 18,082,152 7,697,202 22,323,262 $48,102,616 22,232,256 25,206,963 41,148,367 3,381,194 44,529,561 44,145,234 4,256,927 48,402,161 $61,206,905 62,836,677 124,043,582 $61,777,555 59,934,185 121,711,740
LOCAL TAXES COLLECTED
Property Tax dollars collected for the general fund from operating levies are used to pay for day-to-day operating expenses of the District, including salaries, benefits, utilities, books, materials, and equipment. Local property taxes (42.25 mills) collected from Commercial Real Estate for Fiscal Year 2014 totaled $17,888,210 (54.5 percent of total taxes collected). The District collected $13,922,708 (42.4 percent of total taxes collected) in Residential Real Estate taxes (35.28 mills) in fiscal year 2014. Beachwood has not had an operating levy on the ballot since 2005 Public Utility Taxes are assessed on tangible personal property, as well as land and improvements, at true value (normally 50 percent of cost). The District collected $1,004,267 (3.1 percent of total taxes collected) from public utility property taxes in Fiscal Year 2014.
retirement of 11 staff members who were replaced by less senior staff.
2014 2013 2012
• • • •
$71,065,301 45,768,048 116,833,349
47,070,449 5,925,001 52,995,450
OPERATING LEVY CYCLES Local School District Operating Levies Since 2005
22,611,659
2006, 2010, 2014 Shaker Heights 2005, 2010, 2013 Solon
18,670,053 3,818,435 18,737,752 $41,226,240
2005, 2007, 2008, 2010, 2011, 2012 Aurora 2005, 2008, 2012 South Euclid-Lyndhurst 2008, 2012 Mayfield 2007, 2012 Chagrin Falls 2007, 2011 Cleveland Heights-University Heights 2006, 2010 (failed), 2011 Hudson 2011 Orange 2005 Beachwood
REVENUE
• The District’s revenues increased by 5.4 percent over 2013 due • Program Revenues ($6,159,860) • •
are for specific program areas and comprise 13 percent of the District’s total revenues. General Revenues ($36,597,587) account for 75 percent of all revenues. The largest portion of general revenues is property taxes levied on commercial and residential properties. Grants and Entitlements ($5,687,462) comprise 12 percent of the District’s revenues, and are from the State of Ohio and the federal government.
primarily to the District receiving unbudgeted revenue from the settlement of litigation regarding the valuation of real property.
2014 2013
2012
$3,920,001 3,190,174
2011
$4,432,301 3,368,012
Program Revenues
Charges for Services and Sales Operating Grants and Contributions
$2,837,045 3,322,815
$4,346,756 3,026,362
General Revenues
Property Taxes Grants and Entitlements Investments Other
33,708,619 5,687,462 176,869 2,712,099
27,450,186 5,647,472 73,323 5,436,826
28,034,000 6,385,851 221,860 298,808
26,914,433 6,845,143 332,985 250,458
Total Revenue
$48,444,909 $45,980,925 $42,050,694 $42,143,332